


















Proxy Health Checks: Verify Exit IP, Latency, and Valid Results
Build continuous proxy health checks that separate connectivity, authentication, observed exit market and valid destination results, with actionable metrics and alerts.
 Written byNora



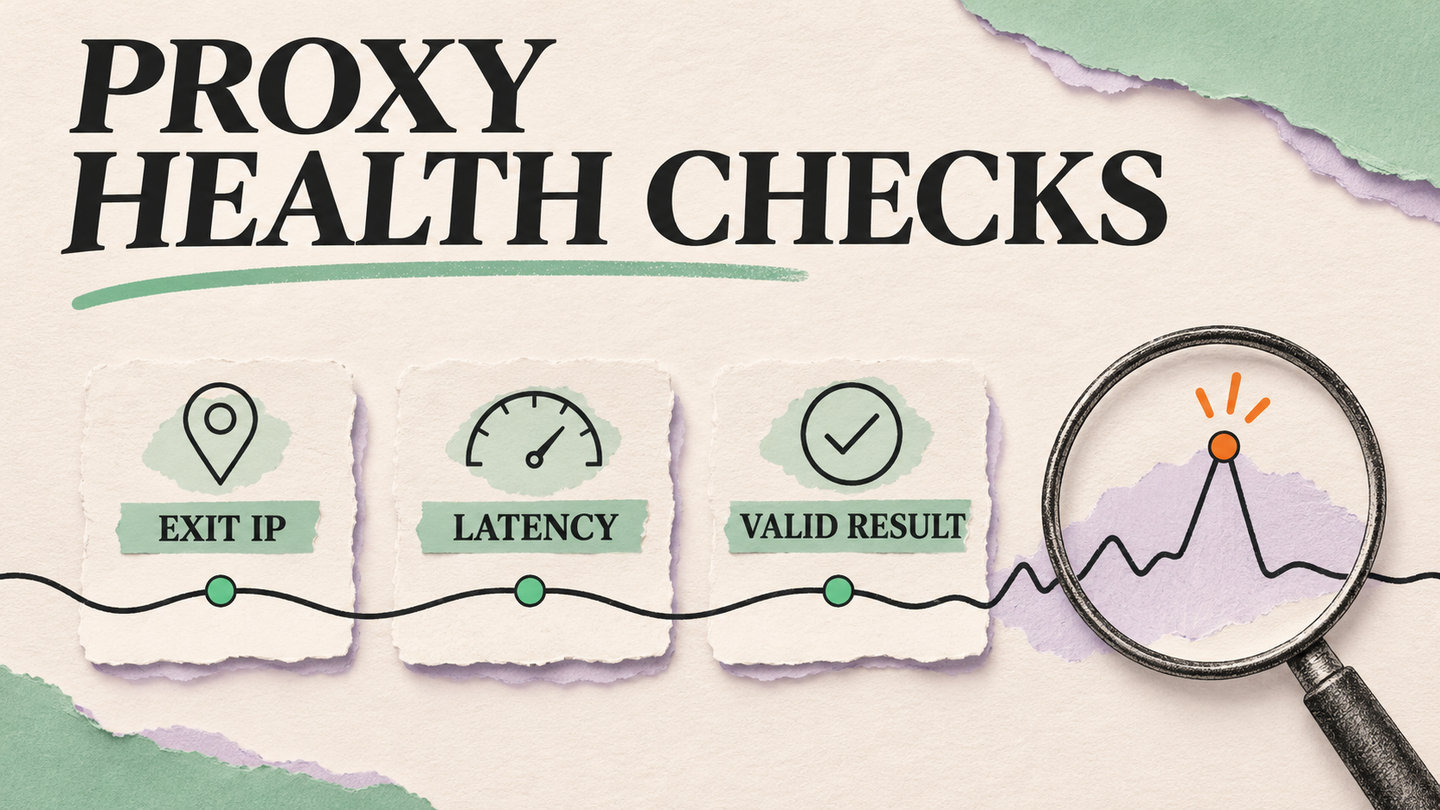
A proxy is not healthy merely because its port answers. An operator can connect and authenticate, yet exit from the wrong market, receive a challenge page, or deliver a record that fails the collection contract. Conversely, a source outage can make a healthy proxy look broken. A useful health check separates those states, samples them continuously, and pages a person only when a user-facing result is at risk. This guide treats proxy health as an observable workflow rather than a one-time connectivity test.
1. Define a healthy result before choosing probes
Write an acceptance contract for each workflow: the permitted destination class, required country or region, session behavior, expected content fields, freshness window, and maximum useful end-to-end time. For a product page, “valid” might mean an identifier, currency, price, availability and observation timestamp from the intended market. A 200 status without those fields is not a successful collection. Keep the contract versioned so a parser change does not silently redefine success.
Separate a synthetic probe from a production outcome. A synthetic request to a diagnostic endpoint you control answers whether a route can connect and which public IP it presents. A small permitted destination probe tests whether a representative source returns accepted content. Production metrics show what real jobs experienced, but can move because workload mix changes. Use both views: synthetic probes isolate the route; production outcomes determine whether the service is useful. The OpenTelemetry HTTP metric conventions provide a standard client-duration histogram and response-status attribute, but application acceptance needs your own explicit metric.
2. Test the path in layers and preserve the evidence
Run probes from the same worker network and client settings used by the workload. Record a stable route identifier, product type, intended market, protocol, target class, time and probe version. First test whether the worker reaches the proxy endpoint. Then distinguish successful proxy authentication from an HTTP 407 Proxy Authentication Required. A 407 is a proxy-side signal; do not classify it as a destination block.
Next call an approved IP-echo endpoint and record the observed public exit IP. Compare it with the intended route and a location signal, while remembering that IP geolocation databases are estimates. For a market-sensitive workflow, also inspect the destination's visible currency, language, shipping region or other relevant market cue. A country label from one database cannot prove the page was served for that market. Keep credentials, full URLs with secrets, cookies and raw personal data out of telemetry.
Finally, request a small set of permitted destination pages. Keep HTTP status, redirect chain, TLS result, elapsed time, response size and a sanitized content-validation outcome as separate fields. RFC 9110 defines the HTTP status semantics; it does not say a 200 body satisfies your business schema. A challenge, login wall, empty page or stale record must be classified separately from a valid result. Do not infer a provider incident from a single destination failure.
3. Design samples that can reveal a real regression
Partition probes by the dimensions you can act on: product, intended market, protocol, session policy and worker region. For Arcvenza Residential Proxies, rotating and persistent routes answer different questions, so test each configuration you actually use and record the observed exit for every sample. For Arcvenza ISP Proxies, a stable endpoint can support a repeated baseline; still verify that its observed route and result remain correct. Avoid creating one time series per raw IP or URL: high-cardinality labels make metrics expensive and harder to reason about, as OpenTelemetry's metrics guidance explains. Keep detailed sample IDs in bounded logs or traces.
Choose probe targets deliberately. Include one controlled echo endpoint, a small permitted destination sample, and, where useful, a matched direct or alternate-route control. Rotate the destination sample by a documented schedule so a single easy page does not hide a workload failure. Keep sampling cadence and target mix stable when comparing periods. Record the denominator and the reason for any planned exclusion before the measurement window starts; otherwise “success rate” can improve simply because difficult cases disappeared.
Minimize load on third-party sources. Follow their terms and robots rules, and stop or back off when rate limits appear. RFC 6585 defines 429 Too Many Requests and notes that a response may include Retry-After. A health system that repeatedly probes a pressured source can create the incident it claims to detect.
4. Measure outcomes, latency and failure stage separately
Define accepted-result rate as accepted eligible probes divided by all eligible probes in the same route, target class and window. Count connection, authentication, wrong-market, destination and content failures in that denominator, while preserving each failure stage as its own category. Track p50 and p95 end-to-end duration for a clearly defined population, plus connect and TLS timings when your client exposes them. A p95 from a handful of probes is unstable; report sample count and use a window with enough observations. Prometheus histograms support aggregation and quantile estimation when buckets and labels are chosen deliberately.
| Observed signal | What it establishes | What it does not establish | First operational check |
|---|---|---|---|
| Proxy connection succeeds | Worker can reach this endpoint now | Authentication, exit market or valid page | Confirm credential mode and next layer |
| Proxy returns 407 | Authentication is missing or rejected | Destination policy | Check allowlist or credential status securely |
| Echo shows expected IP and market | This probe used a plausible egress | Target serves the intended regional content | Check target market cues and session state |
| Destination returns 200 | An HTTP response was received | Record is complete, fresh or unchallenged | Validate required fields and page type |
| Accepted-result rate falls | Useful output declined in this segment | Which component caused the decline | Compare failure stages and a control route |
Report route-level availability and application-level acceptance side by side. A provider can have excellent connect success while accepted records fall because a site changed its layout. Conversely, a target can be healthy while one route segment has authentication or geographic drift. The split makes triage faster and prevents a misleading single “proxy uptime” number.
5. Set alert thresholds from user impact and an error budget
Choose a service-level objective for accepted results over a stated period, then calculate the error budget from the number of eligible attempts in that period. For example, the budget is the allowed fraction of attempts that fail the acceptance contract; it is not a guarantee that every target will always respond. Establish the objective from a measured baseline and business tolerance rather than copying a vendor's advertised success rate. Keep targets and exclusions in the definition so the trend remains comparable.
Alert on symptoms that require action: sustained accepted-result loss, a route segment with repeated wrong-market exits, or latency that makes results unusable. Use a short window to catch severe incidents and a longer window to confirm smaller regressions; require enough samples and a persistence period before paging. A separate low-urgency alert should detect missing probes or stale telemetry, because silence is not health. Prometheus alerting guidance recommends actionable symptoms, room for brief blips and monitoring of the monitoring path itself. Attach the affected segment, sample count, last valid result and runbook link to each alert.
Do not page solely because one IP rotated, one request returned 429, or one destination changed markup. For a residential rotating route, changing egress may be expected; for a stable ISP route, unexplained change may merit investigation. Thresholds should reflect that distinction. Review false positives and missed incidents after every alert-policy change.
6. Triage incidents without hiding the original failure
Start with scope: one worker, one route segment, one market, one target, or the whole fleet? Compare the echo probe, permitted destination sample, direct or alternate control, and recent configuration changes at matched times. If proxy connection fails, inspect endpoint reachability and network path. If 407 rises, check credential or allowlist changes without logging secrets. If echo egress changes, verify the route configuration and provider status. If only one destination returns 403 or 429, review its policy and request load before blaming the proxy; slow or stop rather than switching IPs to maintain the same pressure.
If status remains 200 but accepted-result rate falls, save a permitted, redacted sample and inspect the page type, market cues, schema and parser version. Record when the incident started, which customer results were affected, what control disproved alternative causes, and when a valid sample was restored. After recovery, replay a small set of authorized checks and update the acceptance contract or alert threshold only with an explicit reason. Continuous health checking is valuable because it connects route evidence to usable outcomes, not because it makes a green dashboard easy to produce.
Official Standards & Technical Documentation
Arcvenza — Residential Proxies route and session controls
Arcvenza — ISP Proxies stable endpoints
IETF — HTTP Semantics (RFC 9110)
IETF — HTTP 429 Too Many Requests (RFC 6585)
IETF — Robots Exclusion Protocol (RFC 9309)
OpenTelemetry — HTTP client metric conventions
OpenTelemetry — Metrics and cardinality